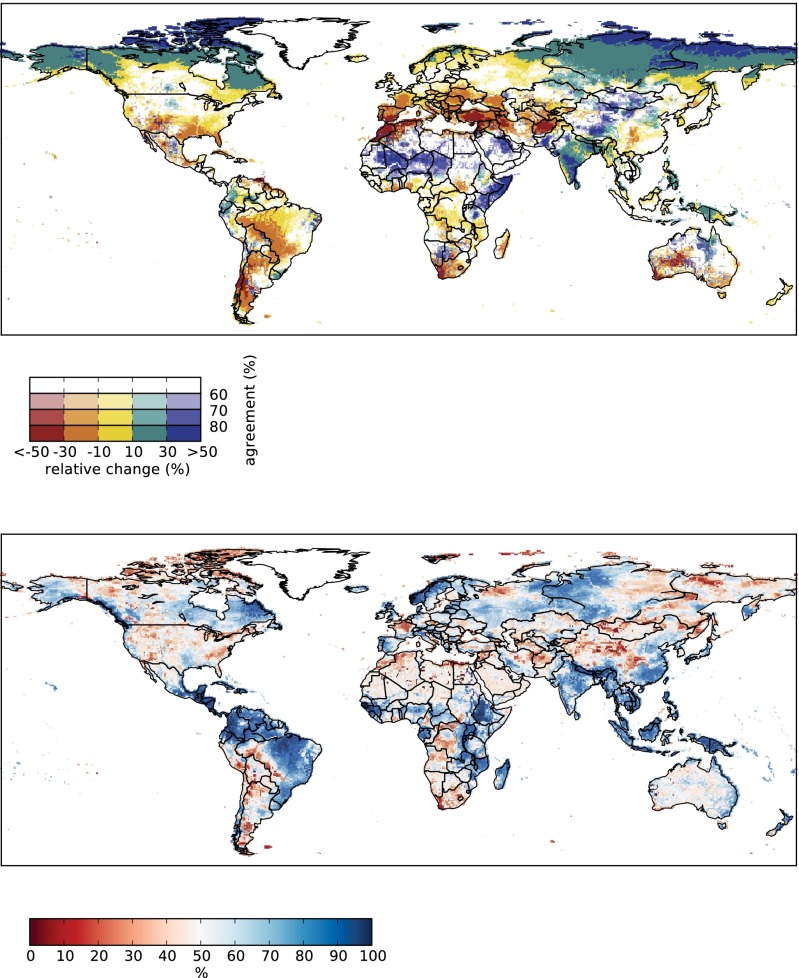
Fig. 1.
Relative change in annual discharge at 2 °C compared with present day, under RCP8.5. (Upper) Color hues show the multimodel mean change, and saturation shows the agreement on the sign of change across all GHM–GCM combinations (percentage of model runs agreeing on the sign; color scheme following ref. 58). (Lower) Ratio of GCM variance to total variance; in red (blue) areas, GHM (GCM) variance predominates. GHM variance was computed across all GHMs for each GCM individually, and then averaged over all GCMs; vice versa for GCM variance. Greenland has been masked.

