Fig. 1.
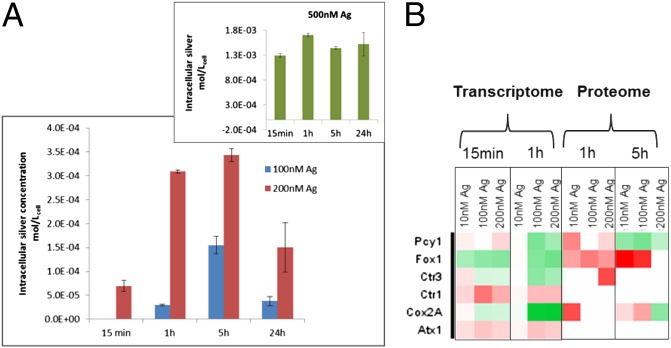
Uptake and transport of silver in C. reinhardtii. Intracellular concentrations of silver (A) on exposure to 100 and 200 nM, and (Inset) to 500-nM exposure. No intracellular silver was quantifiable in C. reinhardtii exposed to 10 nM silver and is therefore not shown in the graph. Heat map of Cu transporters (B) in C. reinhardtii exposed to silver for varying durations with each box representing a protein at the transcriptome and proteome level, green being down-regulated and red up-regulated. The SD is shown in the figures. Atx1, antioxidant 1, copper chaperone; Cox2A, subunit 2A of cytochrome oxidase; Ctr1 and -3, copper transporter 1 and 3; Fox1, Ferroxidase; Pcy1, Plastocyanin. For the molecular responses, algae exposed to 500 nM Ag+ were not analyzed (see Methods).

