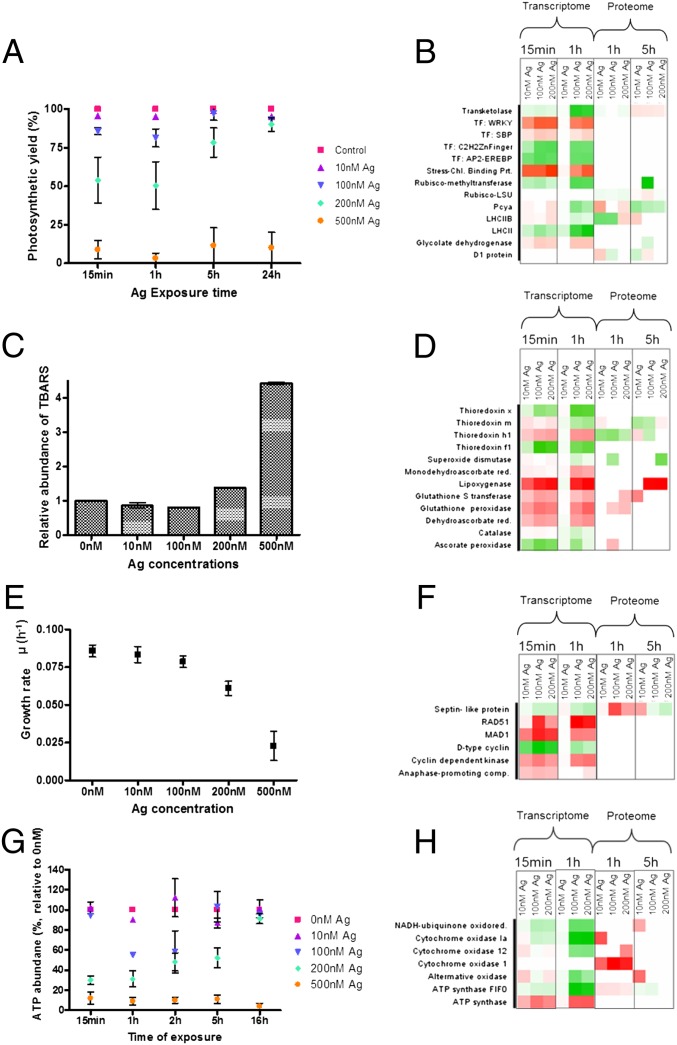
Fig. 2.
Regulation of functional pathways in C. reinhardtii at physiological (A, C, E, G) and molecular (B, D, F, H) levels. Photosynthesis (A, B); lipid peroxidation compared with the control (C) and oxidative stress response (D); growth (E, F); ATP content (G) and synthesis (H). In the heat maps each square represents a protein, with green being down-regulated and red up-regulated. For the molecular responses, algae exposed to 500 nM Ag+ were not analyzed (see Methods).

