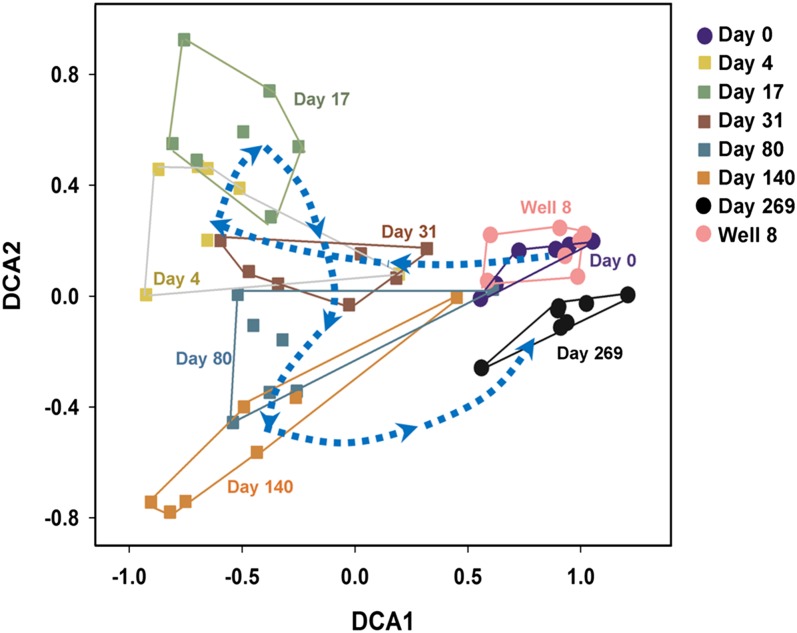
Fig. 2.
Detrended correspondence analysis (DCA) of all detected functional genes, showing successional trajectories of the groundwater microbial communities in the seven downgradient wells at day 0 (preinjection), 4, 17, 31, 80, 140, and 269 as well the upgradient control well. Colors of symbols represent different days for sampling.

