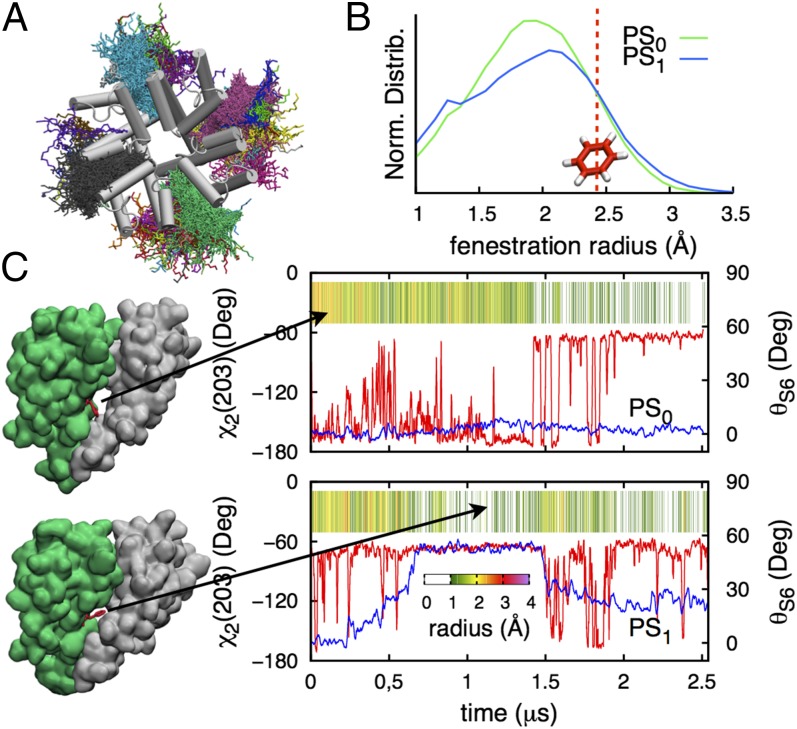
Fig. 6.
(A) Top view of the PD showing different colored lipids seen within lateral openings during the PS1 simulation. (B) Normalized distributions of fenestration radius for PS0 (green) and PS1 (blue), with red line marking the radius of benzene (∼2.47 Å). (C) Dihedral χ2 of F203 (red curve) and bending angle θS6 (blue curve) for segments D and B in PS0 and PS1, respectively, with corresponding fenestration size as a function of time.

