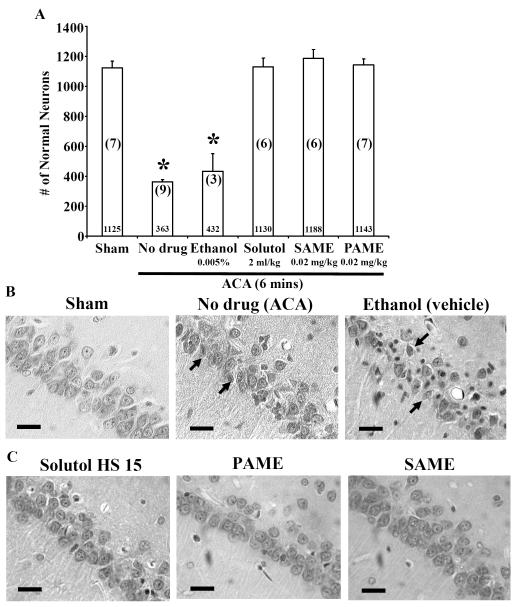
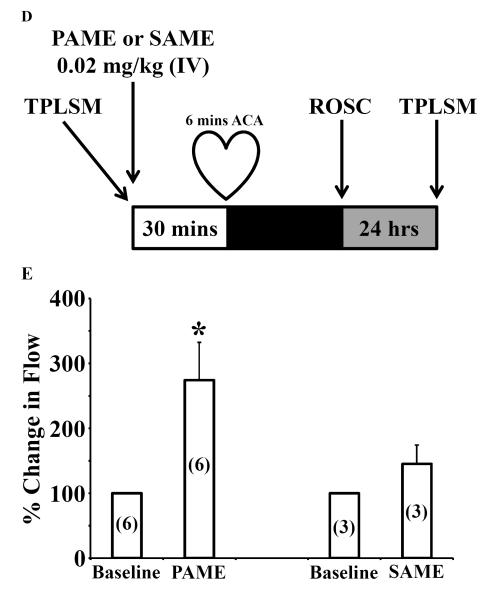
Figure 2.
Rats pretreated with PAME (0.02 mg/kg), SAME (0.02 mg/kg), and Solutol HS 15 (2 ml/kg) provide neuroprotection in the CA1 region of the rat hippocampus 7 days after ACA. Rats were pretreated with PAME/SAME (IV bolus 30 mins before ACA), and Solutol HS 15 (IP, once daily for 14 days before 6 mins of ACA). Sham (no ischemia), no drug (ACA only), and ethanol (vehicle control) groups were performed as internal controls. Neurons from the CA1 region of the hippocampus were counted and expressed in the bar graph shown in A. Numerical values in the bar graph represent the number of normal neurons counted. Numbers in parentheses indicate the number of animals used per group. Representative images of the CA1 region of the hippocampus are shown in B-C. Arrows represent typical neuronal cell death in the CA1 region of the hippocampus. Short horizontal solid bars represent 30 μm in length in the field of view of each representative image (n = 3-9, * p ≤ 0.05). (D) Schematic diagram of the experimental design of in vivo imaging of cortical microvessels via TPLSM in the anesthetized rat. (E) Linescans of the cerebral vessel were performed to determine CBF in cortical microvessels. Each animal serves as its own control (baseline measurement of CBF before ACA and/or PAME/SAME. The data is expressed as percent change in flow from baseline (control) (n = 3-6, * p ≤ 0.05).


