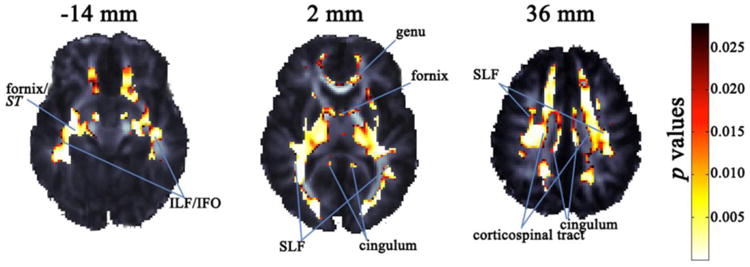
Figure 3. FA association with the optimal five-SNP model of theNTRK3gene, displayed on a study-specific FA template.

Highlighted areas are the p values indicating voxels in which the NTRK3 SNPs (rs1017412, rs2114252, rs16941261, rs3784406, and rs7176429) in our optimal model are associated with FA after adjusting for age and sex (FDR critical p value = 0.028). The left brain hemisphere is displayed on the right. Coordinates listed are for the Z direction in ICBM space. SLF and ILF denote the superior and inferior longitudinal fasciculi, IFO is the inferior fronto-occipital fasciculus, and ST is the stria terminalis.
