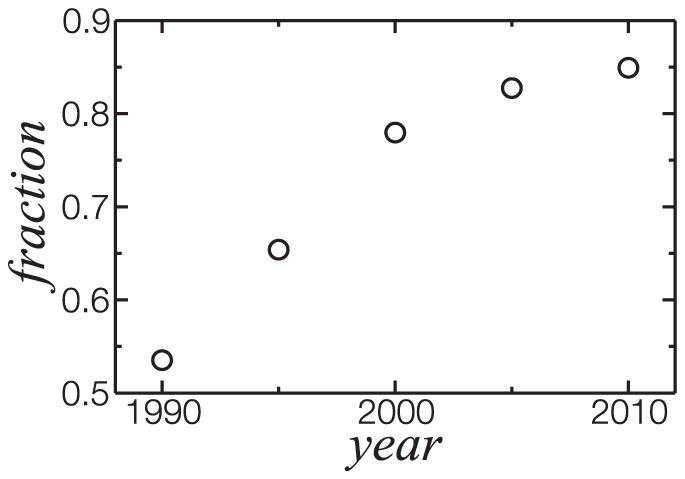
Figure 3. Evolution of the largest component.

Data points represent the fraction of researchers present in the largest component for a five year time window centered in the respective year. More than 80% of the researchers engaged in collaborations in the last 5 years are in the largest component. They represent 61% of the researchers in TCN.
