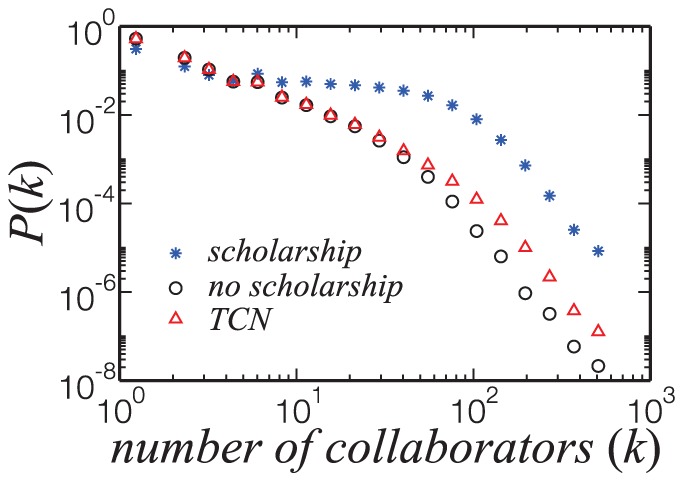
Figure 4. Normalized distribution of the number of collaborators ( ) of researchers with scholarship (blue stars), without (black circles) and for the TCN (red triangles).

The distribution for researchers with scholarship decreases slowly up to one hundred collaborators, although most of them still have a small number of collaborators. The higher proportion of researchers with high  might reflect the CNPq policy of considering the proponent's participation in research groups, international immersion and human resources development to grant the scholarship.
