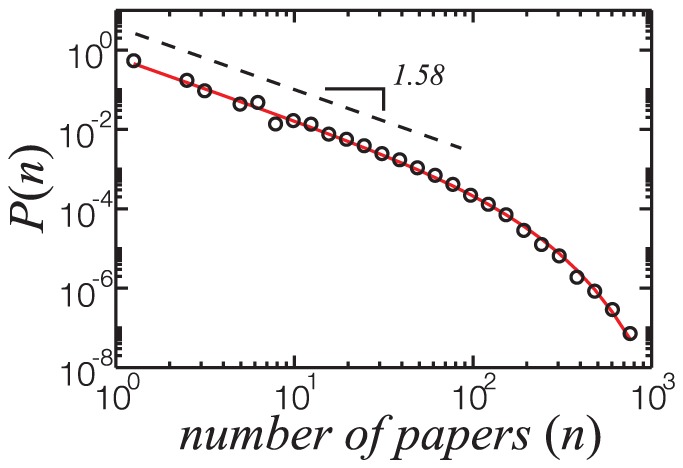
Figure 6. Distribution of scientific production of researchers belonging to the TCN group.

The solid red line is the best fit to the data points of a power-law with exponential cutoff,  , where
  and
and  . The dashed black line is a power-law with exponent
  .
.
