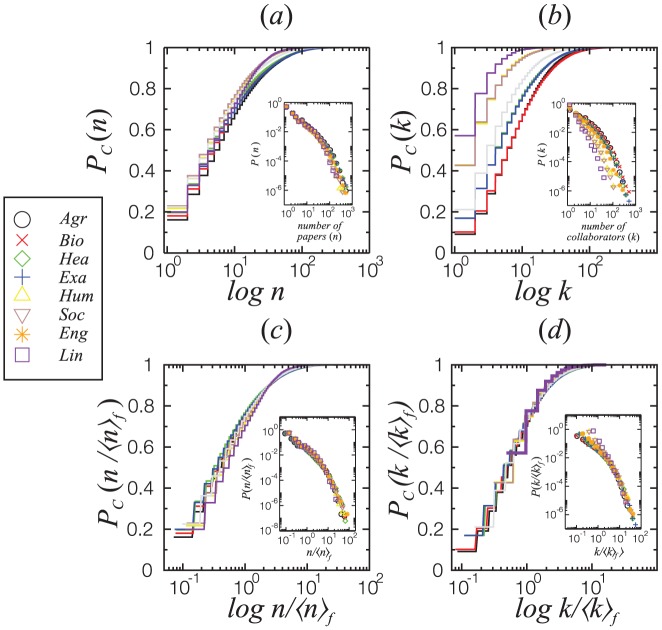
Figure 9. Cumulative distributions  of the number of papers published per researcher
  (a) and number of collaborators (b) for each of the 8 major fields.
The respective distributions for the rescaled data are shown on (c) and (d). Lines represent different fields, colored according to the symbol in the legend. Scientists working on social sciences and related fields (Lin, Soc and Hum) are less likely to have published more than one hundred papers than others. They also are less likely to have more than one hundred collaborators. Considering the average publication count  and average number of collaborations
  in each field, all the curves collapse to a single universal behavior. The insets show the respective (non-cumulative) distributions.

