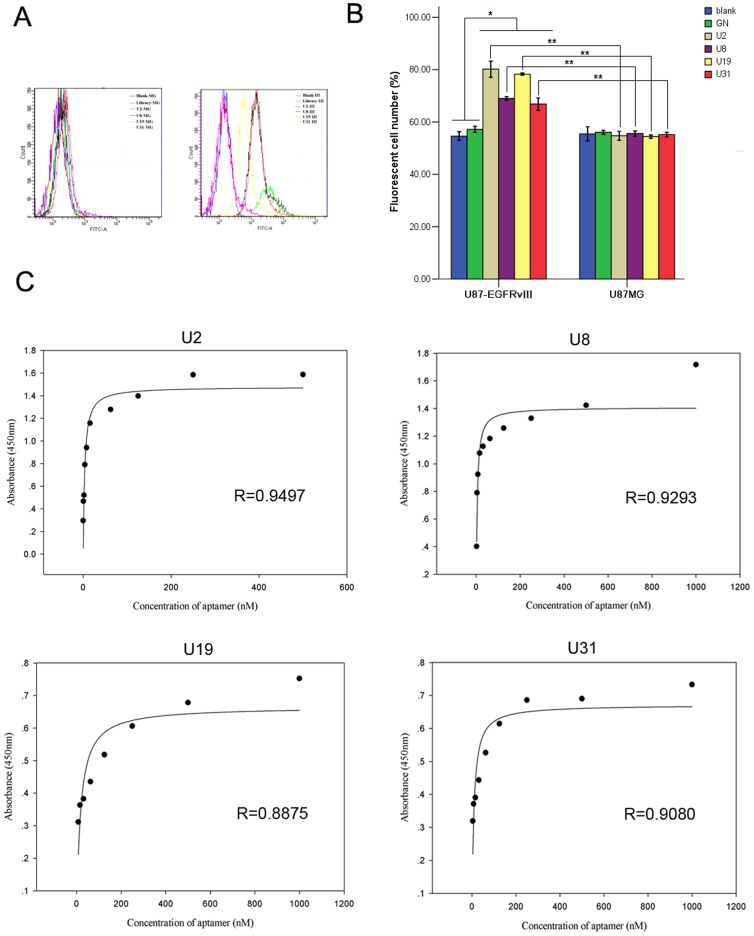
Figure 2. Good specificity and high affinity of selected aptamers to U87-EGFRvIII cells.
(A) FITC-labeled aptamers U2 (red), U8 (black), U19 (green), U31 (yellow), GN (pink) were incubated with U87-EGFRvIII cells (right) and U87MG cells (left), respectively, then subjected to flow cytomety. Unlabeled cells (blue) were used as blank control. (B) Changes in cell number with detectable fluorescence reflected fluorescence intensity shift. Data represent mean ± SD of three independent experiments. * P<0.05, ** P<0.01. (C) Binding curve of U2, U8, U19 and U31 on U87-EGFRvIII cells. The mean absorbance from three independent experiments for each aptamer concentration was used to plot the binding curve.

