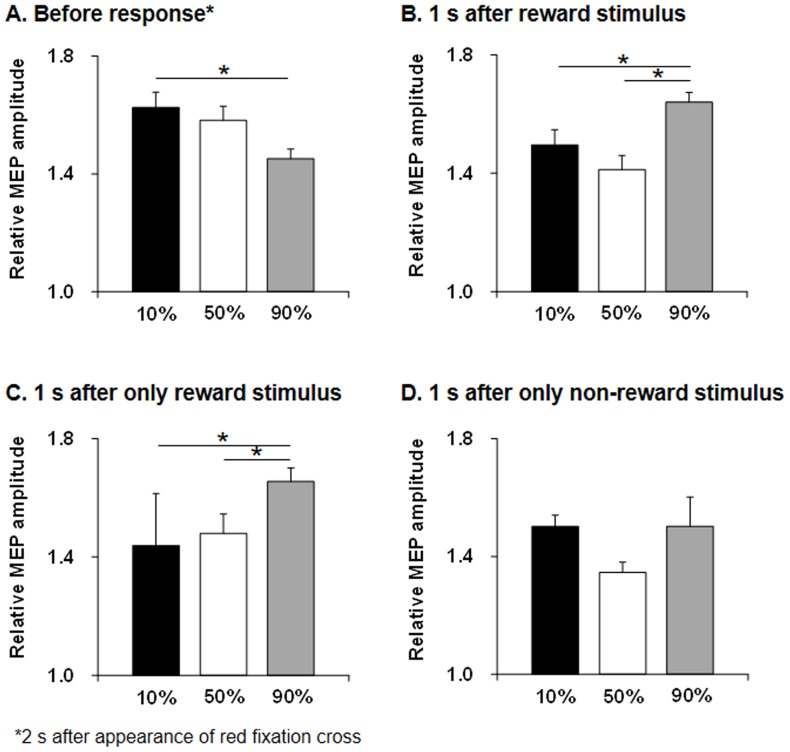
Figure 4. Bar graphs of relative MEP amplitudes for FCR and ECR muscles.
Relative MEP amplitude at 2(A) and at 1 s after reward/non-reward stimuli (B) during the task. Relative MEP amplitude at 2 s after the red fixation cross was significantly higher for 10% reward probability than for 90% reward probability (p = 0.008) during the task, whereas relative MEP amplitude at 1 s after reward/non-reward stimuli was significantly higher for 90% reward probability than for 10% (p = 0.001) and 50% (p = 0.001) reward probabilities. Bar graphs of relative MEP amplitudes for FCR and ECR muscles at 1 s after only reward stimuli presentation (C) and only non-reward stimuli presentation (D) during the task. Relative MEP amplitude at 1 s after only reward stimuli presentation was significantly higher for 90% reward probability than for 10% (p<0.0001) and 50% (p = 0.006) reward probabilities. However, relative MEP amplitudes for FCR and ECR muscles at 1 s after only non-reward stimuli presentation were not significantly changed. MEP, motor-evoked potential; FCR, flexor carpi radialis; ECR, extensor carpi radialis.

