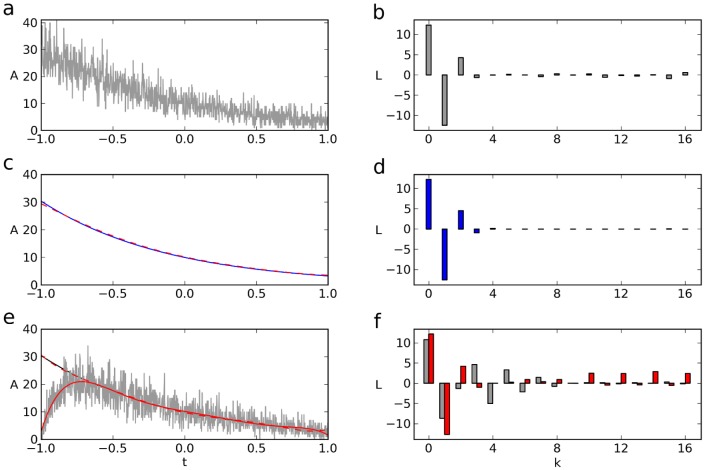
Figure 2. Filtering exponentials convolved with a system response function.
(a) Exponential on the interval [−1, 1] with Poisson noise added. Amplitude,  , time constant
  . (b) Legendre spectrum of x as resulting from eq. 5. (c) Mean
  of
of  (continuous) and inverse fLT (dashed, eq. 6) of
  through
  of the spectrum shown in b. (d) Legendre spectrum of the mean
  , largely lacking higher noise components. (e) Noisy curve is the convolution of
  with
with  and
and  .
.  was chosen such that the curve overlaps with
  for large
  . (f) Legendre spectrum (gray bars) of convoluted noisy exponential shown in e (continuous curve). The lowpass-filtered inverse transform is shown in e (continuous curve) and approximates the convoluted noisy exponential. In addition, f shows the Legendre spectrum of
  , obtained through eq. 9. The lowpass-filtered inverse transform of this spectrum is shown as the red dashed curve in e and approximates the original non-convoluted exponential, from which the noisy convoluted curve was generated.

