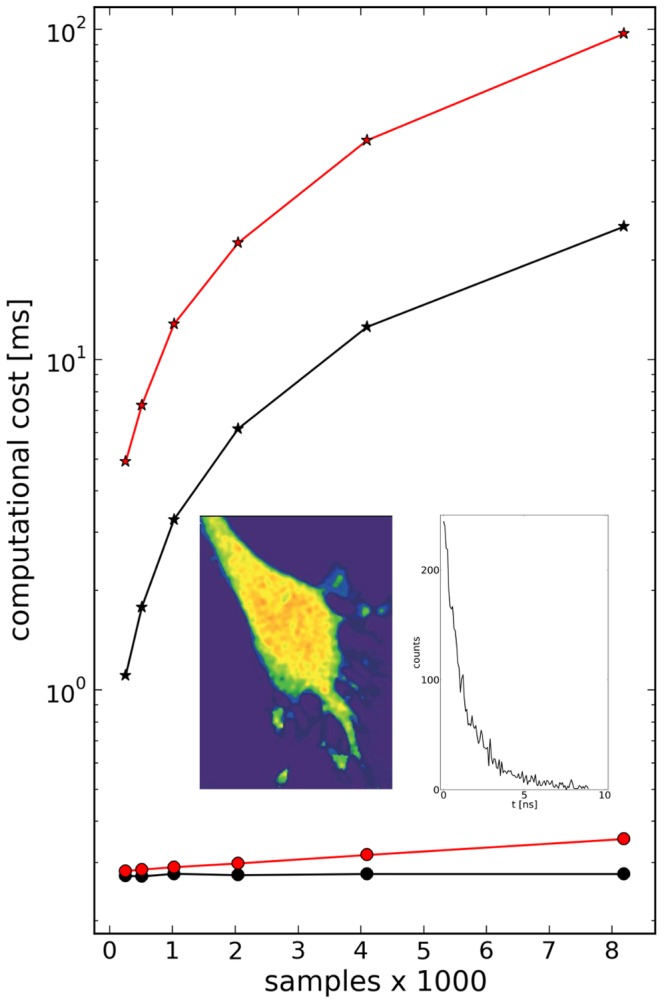
Figure 7. Computational cost of fitting in time - and Legendre - domain.

Dots and asterisks indicate the computational cost in Legendre - and time - domain, respectively, on a logarithmic scale. Black and red curves refer to whether (red) or not (black) a system response function was taken into account. Each point or asterisk is the average duration of  computations. As the analysis in the time - domain is fastest when using the Fast Fourier Transform, we choose the sample sizes to be powers of
  , starting with
  . Inset, left, FLIM image of a mouse hippocampus neuron probed for oxidative stress using the hydrogen peroxide sensor HyPer [13] and, right, fluorescence lifetime function for one pixel in the middle of the cell (150 samples, data courtesy K. Kizina and M. Müller, CNMPB, Göttingen).
