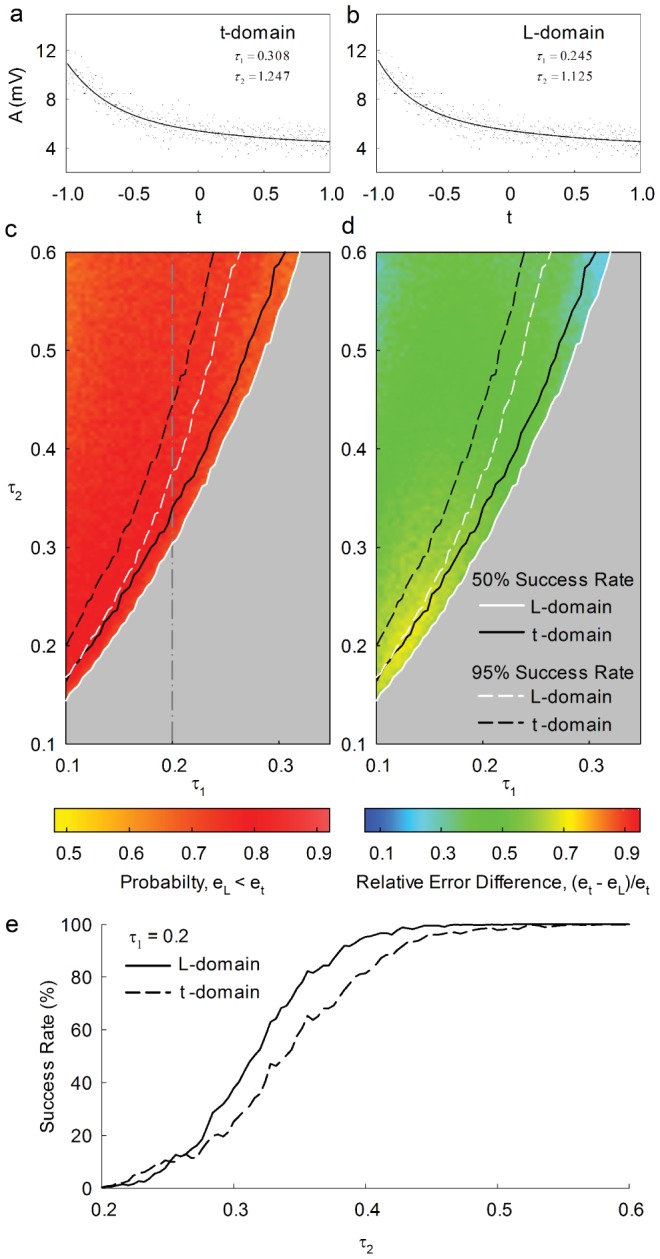
Figure 8. Double exponential decay analysis in time- and Legendre-domain.

(a,b) The interaction of Ru(II) complexes with DNA (same as in in Fig. 1) shows double exponential decay([12], data courtesy of F. Secco, Univ Pisa,I). Same data fitted in t- (a) and L-domain (b). (c) Probability for the fitting error in the L-domain,  , to be smaller than that in the t-domain,
  , represented as a function of
  and
and  . Color code of the probability is shown beneath the plot. For each pair (
 ) 1000 trials were computed. (d) Relative difference of fitting errors,
  , as a function of
  and
and  . Color code beneath the plot. 1000 trials per pixel. Left of the solid and dashed white lines in a and b, the success rate of the fit in the L-domain is larger that
  and
and  , respectively. Left of the solid and dashed black lines in c and d, the success rate of the fit in the t-domain is larger that 50% and 95%, respectively. Relative error differences were calculated only for successful trials. (e) Success rate of fitting in the L-domain (solid) and t-domain (dashed) along the vertical line in c, i.e., as a function of
  with
with  kept at
  .
.
