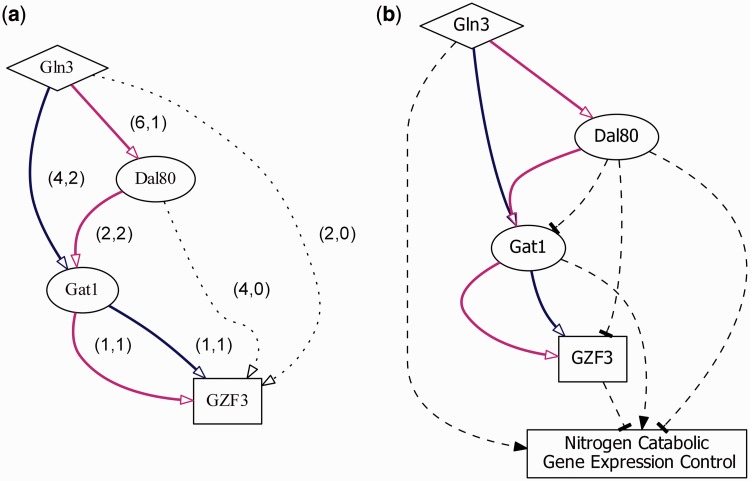
Figure 4.
Nitrogen catabolic gene expression control. Two enumerated TRPs of the TF-gene regulatory pair: Gln3-GZF3. (a) In the figure, (x, y) stands for the number of TFR and TFB evidence, respectively, that support the biological relevance for each TF-gene pair along the direction of the two enumerated TRPs (Gln3→Gat1→GZF3 and Gln3→Dal80→Gat1→GZF3). Dotted lines indicate indirect regulation. (b) Transcriptional regulatory dynamics inferred from the condition-specific expression data. Dashed lines represent activation (arrowhead) or repression (tee head) regulation.

