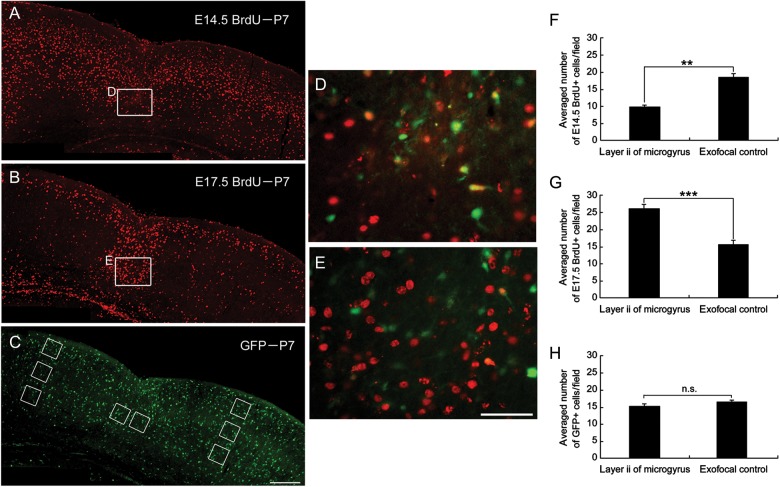
Figure 2.
Distribution of E14.5- and E17.5-born cells and GABAergic cells in FFL mouse cortex at P7. Images of coronal sections of a P7 GAD67-GFP KI mouse that received a maternal injection of BrdU at E14.5 (A) or E17.5 (B), immunostained for BrdU (red). (C) The same P7 coronal slice as in (B), immunostained for GFP (green). Cell-count squares (100 μm × 100 μm) for microgyric (center) and exofocal controls (E17.5 BrdU, upper; E14.5 BrdU, middle and bottom; GFP, upper to bottom) are indicated as boxes. (D) Higher magnification of the boxed area in (A) in layer 2 of the microgyrus. There was a paucity of BrdU-positive cells (red) generated at E14.5. (E) Higher magnification of the boxed area in (B) in layer 2 of the microgyrus. Note the high density of E17.5-born, BrdU-positive cells (red) dispersed throughout layer 2 of the microgyric cortex. GFP immunostaining is also shown in D and E (green). (F–H) Distribution of E14.5-born BrdU-positive (3 preparations, F), E17.5-born BrdU-positive (4 preparations, G), and GFP-positive (8 preparations, H) cells in layer 2 of the microgyrus and the exofocal control cortex (2-tailed t-test, **P < 0.01, ***P < 0.001, n.s., not significant). Scale bars: A–C, 200 μm; D and E, 50 μm.

