Figure 3.
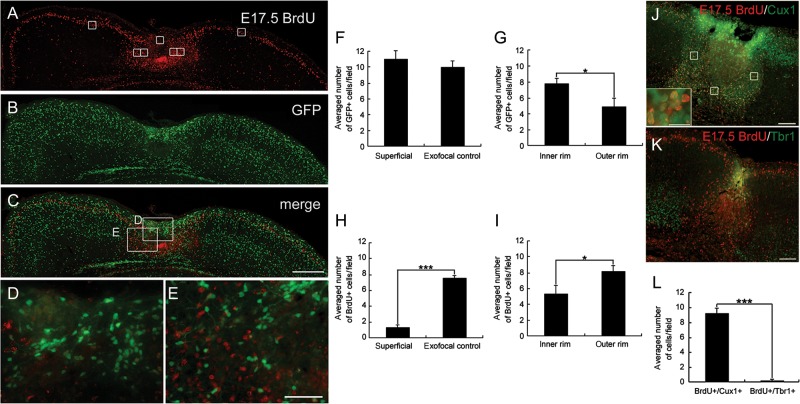
Distribution of E17.5-born cells and GABAergic cells in the FFL cortex at P4. Images of coronal sections of a P4 FFL mouse that received a maternal injection of BrdU at E17.5, immunostained for BrdU (red, A) and GFP (green, B). An accumulation of GFP-positive cells can be detected in the superficial part of the lesioned area (B). (C) Merged images of A and B show an accumulation of E17.5-born, BrdU-positive cells surrounding the GFP-positive cells at the boundary of the lesioned area. (D) Higher magnification of the superficial part of the lesion center as marked in C. (E) Higher magnification of the boundary of the lesion center as marked in (C). (F and G) Distribution of GFP-positive cells in the superficial region (F) and in the inner and the outer rim of the surrounding region within 100 µm of the lesion border (G). (H and I) Distribution of E17.5-born, BrdU-positive cells in the superficial region (H) and in the inner and the outer rim of the surrounding region (I). Note that there is a significant difference in the cell density of E17.5-born, BrdU-positive cells between the superficial and the exofocal regions (H, independent 2-tailed t-test, ***P < 0.001; 3 preparations). Note that there are significant differences in the cell densities of GFP-positive cells (G) and E17.5-born, BrdU-positive cells (I) between the inner rim and the outer rim (independent 2-tailed t-test, *P < 0.05; 3 preparations each). The positions of the cell-count square frames (50 µm × 50 µm) are shown in A. (J and K) Images of double-staining for the layer-specific markers Cux1 (J) or Tbr1 (K) (green) and BrdU (red). A Cux1-positive cell-dense band can be observed in the area surrounding the necrotic tissue (J). Higher magnification shows that the majority of E17.5-born, BrdU-positive cells co-localize with Cux1 (inset in J). Tbr1-positive cells are absent from the microgyric cortex at P4 (K). (L) There is a significant difference in the cell density of E17.5-born, BrdU/Cux1 double-positive cells and E17.5-born, BrdU/Tbr1 double-positive cells in the surrounding region within 100 μm of the lesion border (2-tailed t-test, ***P < 0.001; 3 preparations each). Three cell-count square frames (50 µm × 50 µm) were placed randomly in the surrounding (medial, deeper, and lateral) layer within 100 µm of the lesion border (J). Scale bars: A–C, 200 μm; D and E, 50 μm; J and K, 100 μm; inset of J, 25 μm.

