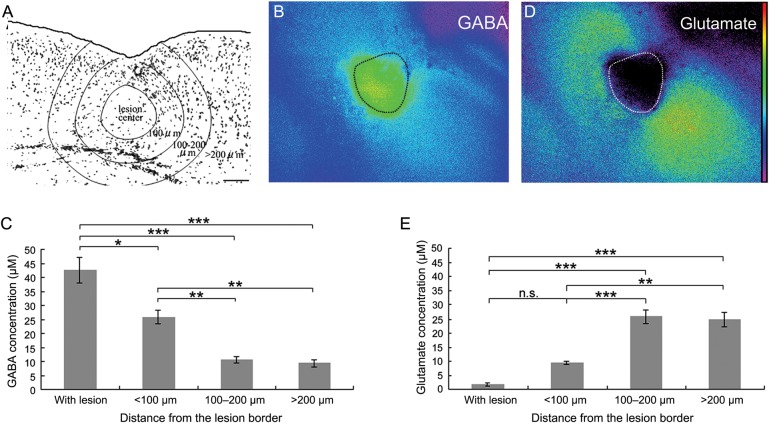
Figure 4.
Temporal increase in ambient GABA in FFL. (A) A representative image showing the distribution of GABAergic neurons in and around the microgyric cortex at P4. (B) An image of extracellular GABA in a P4 acute coronal slice using an enzyme-linked assay system. The dotted line indicates the border of the necrotic tissue. (C) GABA concentration in the microgyric cortex at P4. The GABA concentrations in the lesion center and in the area within 100 μm of the lesion border were significantly higher than that in the area >100 μm from the lesion border (post hoc Tukey test; *P < 0.05, **P < 0.01, ***P < 0.001, n = 10 slices from 6 animals). As a sample for ANOVA, fluorescence intensity was measured and averaged for each zone as indicated in A, from 9 randomly placed square frames (50 μm × 50 μm). (D) Image of extracellular glutamate in the same slice as shown in B. (E) Statistical analysis of glutamate concentration as measured similarly to GABA. The glutamate concentrations in the lesion center and in the area within 100 μm of the lesion site were significantly lower than that in the area >100 μm from the lesion site (post hoc Tukey test; **P < 0.01, ***P < 0.001, n.s., not significant; n = 3 slices from 3 animals). Scale bars: 100 μm.

