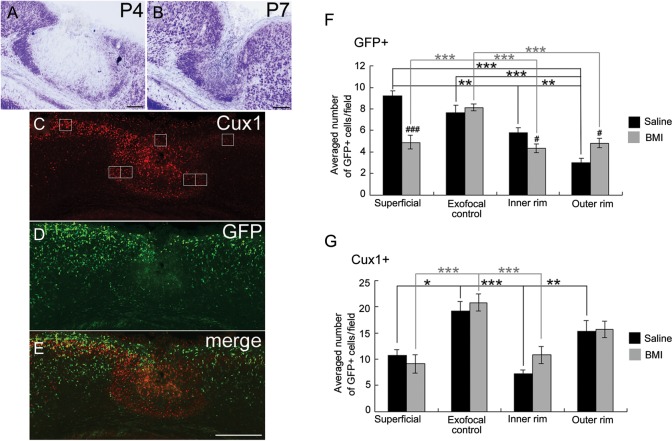
Figure 7.
Distribution of late-born glutamatergic neurons and GABAergic cells in the FFL cortex at P4 after i.p. injection of bicuculline. (A and B) Thionin-stained coronal section from a P4 (A) and P7 (B) GAD67-GFP KI mouse that received FFL at P0 and i.p. injection of BMI from P2 to P4. (C–E) Images of a coronal section of a P4 FFL mouse that received i.p. injection of BMI, followed by immunostaining for Cux1 (red, C) and GFP (green, D). (E) Merged images of C and D show disturbances in the distinct distribution pattern of Cux1-positive and GFP-positive cells at the boundary of the lesioned area after in vivo application of BMI. (F) Effect of BMI on the distribution of GFP-positive cells in 4 different regions (superficial, exofocal control, inner rim, and outer rim). The positions of cell-count square frames (50 µm × 50 µm) are shown in C. Two-way ANOVA (region × drug) revealed a significant region effect (F3,121 = 16.0, P < 0.001), a drug effect (F1,121 = 10.2, P < 0.01), and a significant region × drug interaction (F3,121 = 8.12, P < 0.001). Note that the significant difference between the inner rim and the outer rim was abolished by the application of BMI (post hoc Tukey test, **P < 0.01, ***P < 0.001; saline [black symbols], 5 preparations; BMI [gray symbols], 9 preparations). Significant differences in drug effects were region-specific (independent 2-tailed t-test, #P < 0.05, ###P < 0.001). (G) Effect of BMI on the distribution of Cux1-positive cells in 4 different regions. Two-way ANOVA (region × drug) revealed a significant region effect (F3,36 = 13.1, P < 0.001). Note that the significant difference between the inner rim and the outer rim was abolished by the application of BMI (post hoc Tukey test, *P < 0.05, **P < 0.01, ***P < 0.001, and independent 2-tailed t-test, P > 0.05, saline [black symbols], 4 preparations; BMI [gray symbols], 7 preparations. Scale bars: A and B, 100 μm; E, 200 μm.

