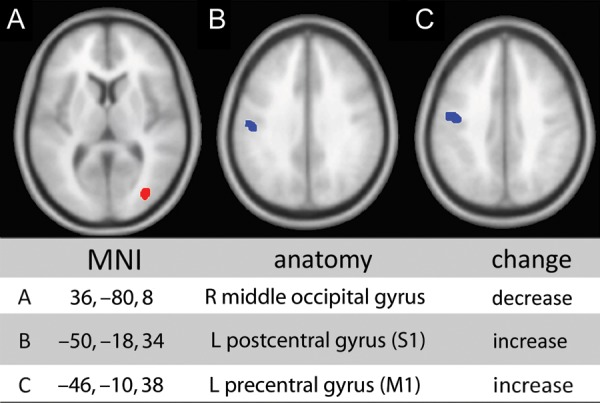
Figure 3.

Significant GM changes in cLBP. Significant changes in the cLBP cohort versus healthy controls through VBM analysis. Blue indicates increased GM density and red indicates decreased GM density (P < 0.001 uncorrected for multiple comparisons, minimum cluster size = 10 voxels).
