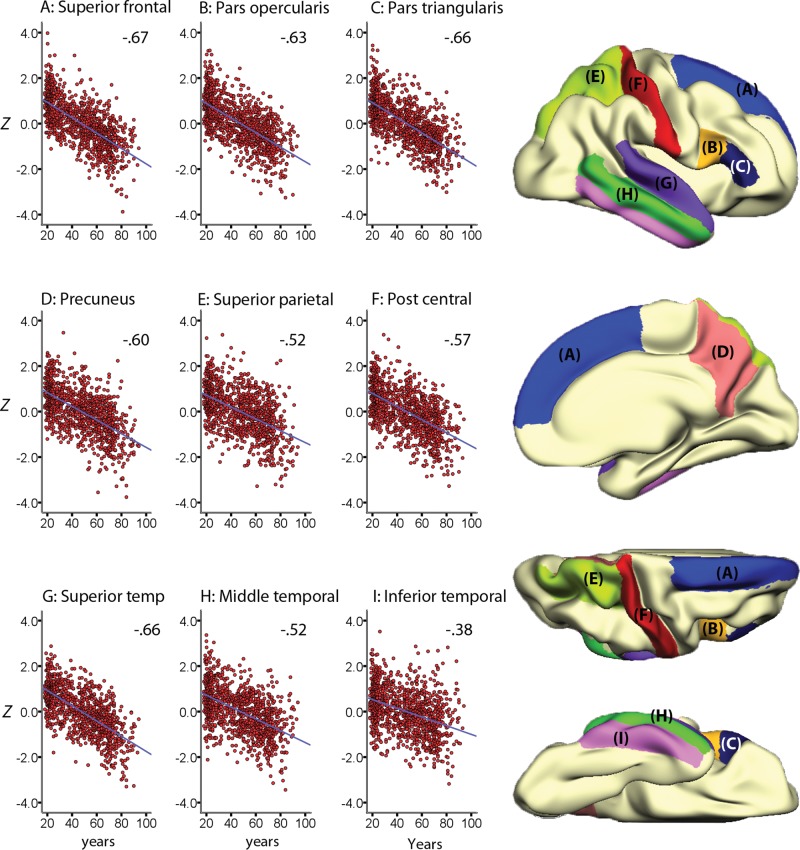
Figure 3.
Linear lifespan trajectories. The figure shows the individual data points and the cross-sectionally estimated trajectories for cortical thickness in 9 representative cortical regions of interest (ROI) where a linear fit was the most appropriate. Values represent mean thickness across hemispheres, corrected for the influence of sample (Z-scores), and the ROIs are displayed on a semi-inflated template brain surface.

