
Figure 4.
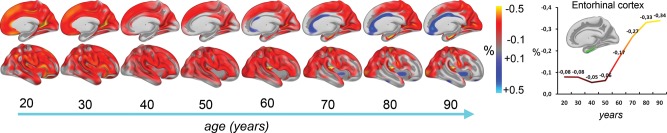
Estimated change per decade from cross-sectional data. Based on cross-sectional data, percentage annual percentage change in cortical thickness was calculated per year, smoothed across time, and displayed per decade. The estimates are adjusted for effects of sample differences and sex. Only right hemisphere is shown. Right panel: Estimated annual change in the right entorhinal cortex, based on cross-sectional data, plotted as a function of age. Note that even for the participants >60 years, these estimates are substantially lower than those obtained from the longitudinal data.