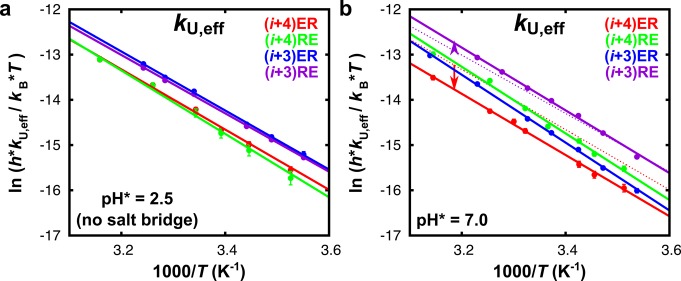
Figure 4.

Eyring plots of the effective unfolding rates (kU,eff) of each of the peptides measured at (a) acidic and (b) neutral pH. The lines are least-squares fits. The dotted lines in (b) correspond to the linear fit of kU,eff measured at acidic pH of peptides (i + 4)ER and (i + 3)RE. The values obtained for ΔHapp (F→U)‡ and ΔSapp (F→U) at acidic and neutral pH are listed in Table S2 (Supporting Information).
