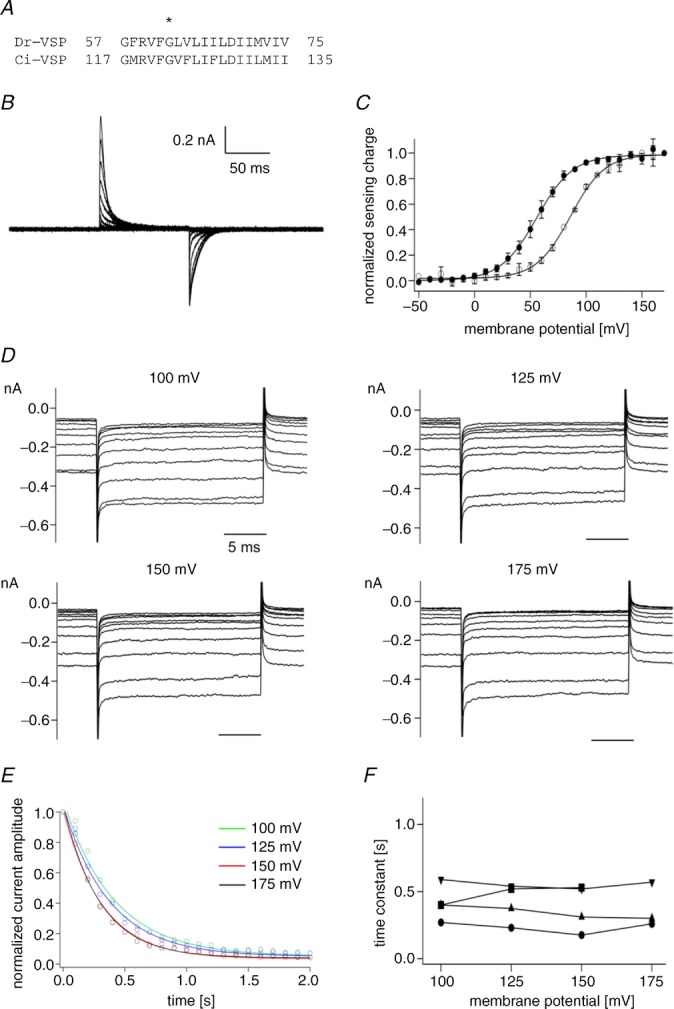
Figure 2.

A, amino acid alignment of S1 in Dr-VSP and Ci-VSP. An asterisk indicates the position of I66 in Dr-VSP and I126 in Ci-VSP. Mutating I126F in Ci-VSP is known to shift the QOFF–V curve by about 90 mV leftward (Lacroix & Bezanilla, 2012). B, representative traces of sensing currents of Dr-VSP(I66F). Voltage steps ranged from −80 to 160 mV in 10 mV increments. Traces for every 20 mV are shown. Leak currents were subtracted by a P/–5 protocol from a holding potential of −80 mV. C, QOFF–V relationship of Dr-VSP(I66F). Filled circles represent normalized sensing charge of Dr-VSP(I66F). Data were fitted by the Boltzmann equation (formula 1). Data are shown as mean ± SD (n = 3). Open circles indicate the normalized sensing charge of wild-type Dr-VSP (same data shown in Fig. 1E). D, families of Kir2.1 currents. Currents elicited during test pulses to −100 mV were superimposed. Only the 1st to 10th episodes are shown. The pulse protocol shown in Fig. 1B was repeated 100 times. The membrane potential was held at −60 mV until Kir current was recovered to the initial level as in Fig. 1. E, normalized current amplitudes were plotted against time. Data sets at four distinct voltages were fitted by a single exponential equation, which is shown by the curves. F, time constants from four patches. The same symbols indicate the data from the same patches.
