Figure 5.
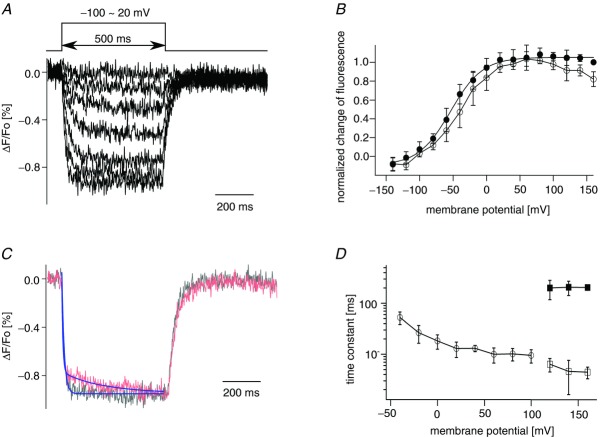
A, optical recording of the movement of the voltage sensor of Dr-VSP(DM). Fluorescence quenching ranging from −100 mV to 20 mV is shown. Traces every 20 mV are superimposed. Holding potential was −100 mV. B, plot of normalized fluorescence quenching against membrane potential. Filled and open circles represent the average of the normalized change of fluorescence of the last 10 ms of the test pulse and the average between 50 and 55 ms after the beginning of the pulse protocol, respectively. Data are shown as mean ± SD (n = 6). C, time course of fluorescence quenching at 100 mV and 160 mV. Lines represent the curves fitted to the data. Data at voltages of 100 (black) and 160 mV (red) were fitted by the single exponential equation and the double exponential equation, respectively. Each episode was normalized by the individual averaged fluorescence intensity between 50 and 55 ms after the beginning of the pulse protocol. D, time constants of the fluorescence quenching are plotted against membrane potential. Fluorescence quenching elicited during the test pulse was fitted by single (≤100 mV) or double (≥120 mV) exponential equations. At less than 100 mV, open circles indicate the time constants from curves fitting fluorescence quenching by a single exponential equation; at more than 100 mV, open and filled squares denote the time constants of the fast and slow components fitted with double exponential equations. Data are shown as mean ± SD (n = 5).

