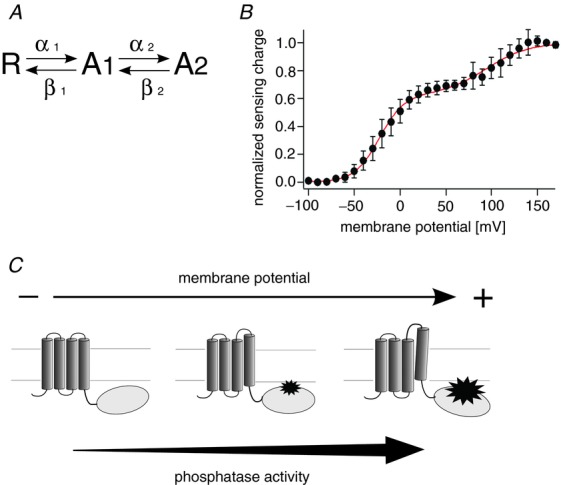
Figure 9.

A, scheme of the state model of the voltage sensor movement of Dr-VSP(DM). R, A1 and A2 refer to the resting, intermediate and fully activated state, respectively. See Methods for the definition of the rate. B, fitting of the model to QOFF–V relationship of Dr-VSP(DM). Red curve indicates the model fit to the QOFF–V relationship. Parameters were estimated to be z1 = 1.76, z2 = 1.05, K1 = 0.19, K2 = 61.8. Black filled circles denote QOFF–V relationship of Dr-VSP(DM). C, the phosphatase activity is graded as membrane potential is altered. Distinct levels of phosphatase activity are coupled to distinct activated states of the voltage sensor.
