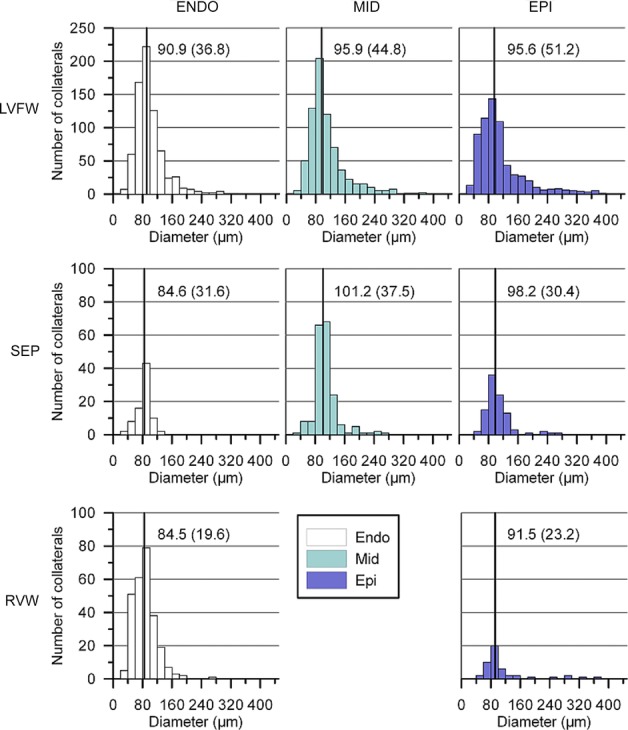
Figure 5.

Data are shown for the total number of collaterals obtained from all study hearts. Median values are indicated by the continuous line for each distribution and are shown together with the interquartile range.

Data are shown for the total number of collaterals obtained from all study hearts. Median values are indicated by the continuous line for each distribution and are shown together with the interquartile range.