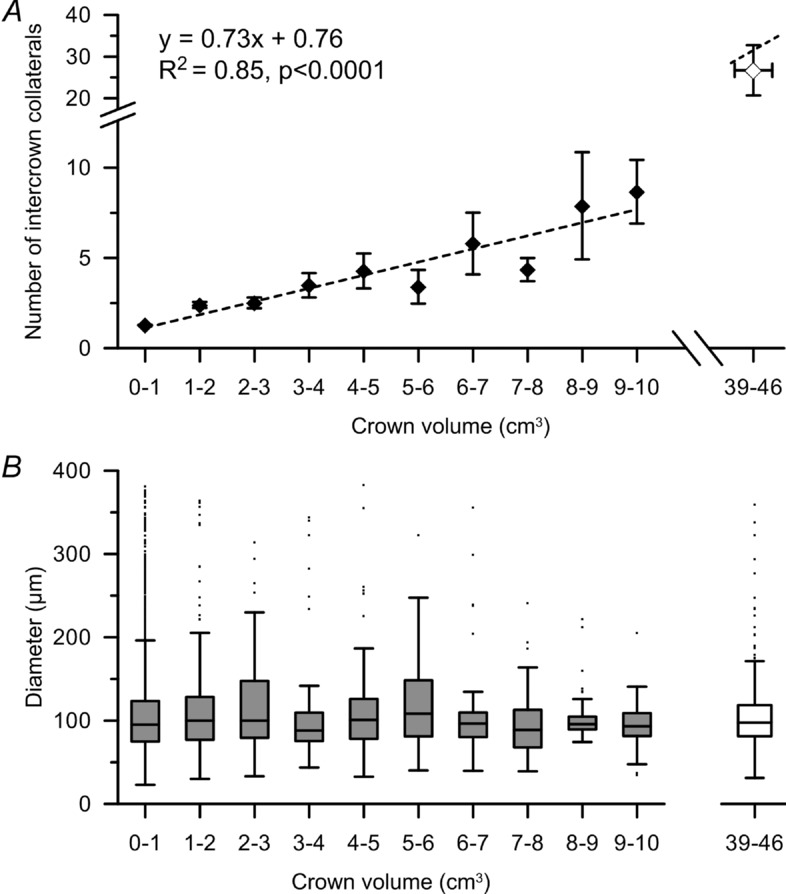
Figure 8.

Data are shown for the total number of collaterals obtained from all study hearts. A, mean and standard error of the number of intracrown connections vs. the average of the two connected crown tissue volumes. The number of collaterals increases by one per 1.4 g of connected tissue volume. The number of intercoronary connections vs. the mean tissue weight of connected larger territories is shown at the right of the plot. Note that this data point is close to the extended regression line for smaller subtrees. B, median and interquartile range of intercrown collateral diameters for increasing average of the two tissue crown volumes connected. Larger connected crown volumes contain more collaterals, but the median and range of collateral diameter is not increased.
