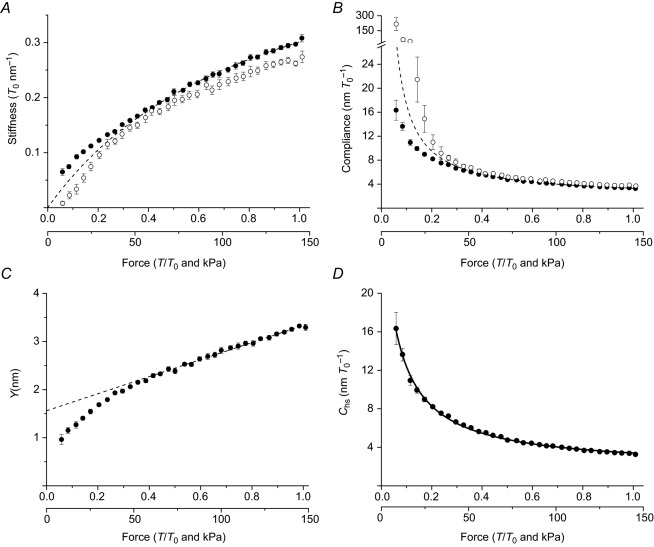
Figure 3.
A, stiffness–force relations. B, compliance–force relations. C, relation between hs strain (Y) and force, calculated from the hs compliance–force data in B. Dashed lines are the relations predicted by the linear elasticity model (model 1 in Fig. 1) as explained in the text. Data are means ± SEM, n = 10 fibres. D, same data as in B fitted with non-linear model 2 (continuous line).

