Figure 4.
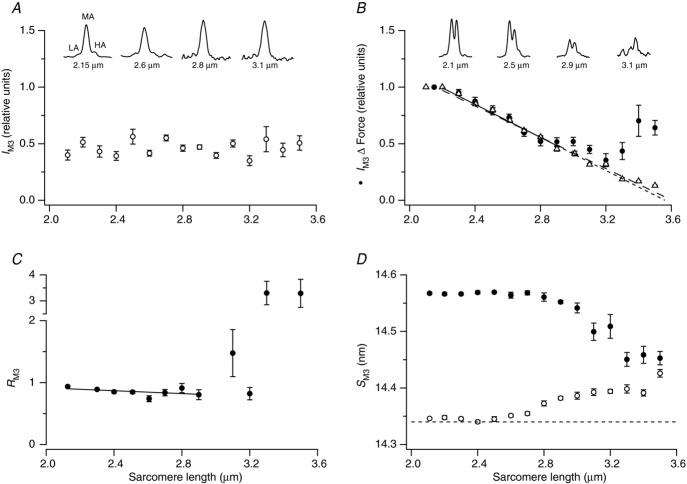
A, intensity of the M3 reflection, IM3, at rest. B, IM3 (filled circles) and isometric force (triangles) during isometric contraction; the regression line for IM3 in the range 2.1–2.9 μm is the continuous line (extrapolated as the short-dashed line); that for force is the long-dashed line. The insets in A and B show the axial profiles of the M3 reflection at the indicated sarcomere lengths. C, ratio (RM3) of the higher and lower angle peaks of the M3 reflection during isometric contraction; the regression line in the range 2.1–2.9 μm (continuous line) has slope –0.115 ± 0.086 μm−1. D, spacing of the M3 reflection (SM3) at rest (open circles) and during isometric contraction (filled circles) recorded in the same fibre bundles.

