
Figure 2.
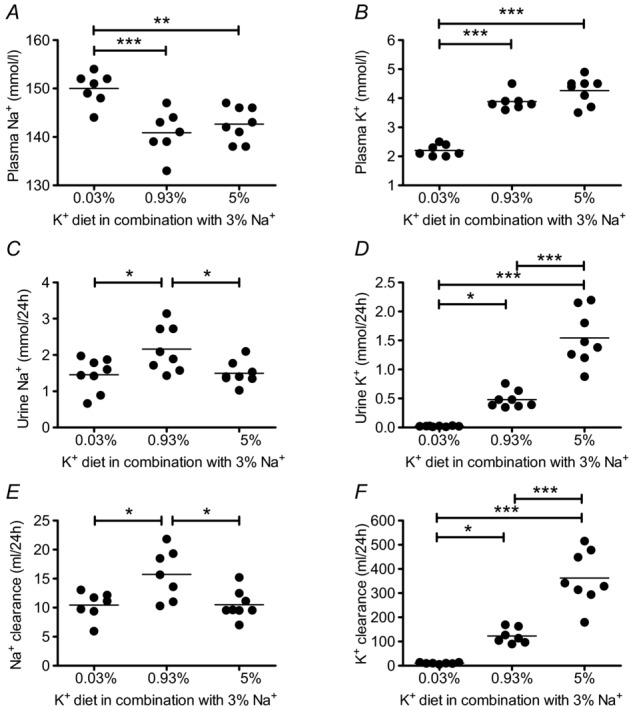
A, B, plasma Na+ and K+ concentrations measured after 10 days of experimental diet (mean ± s.e.m; n = 7–8 each diet). Mice in the low K+ (0.03% K+, 3% Na+) group exhibited hypernatraemia and hypokalaemia. C–F, renal Na+ and K+ excretion and clearance after 10 days of experimental diet (mean ± s.e.m; n = 7–8 each diet). Renal Na+ excretion (C) and clearance (E) were reduced in the low K+ and high K+ (5% K+, 3% Na+) groups. Renal K+ excretion (D) and clearance (F) increased with the amount of K+ in the diets (*P < 0.05, **P < 0.01, ***P < 0.001, one-way ANOVA).