
Figure 5.
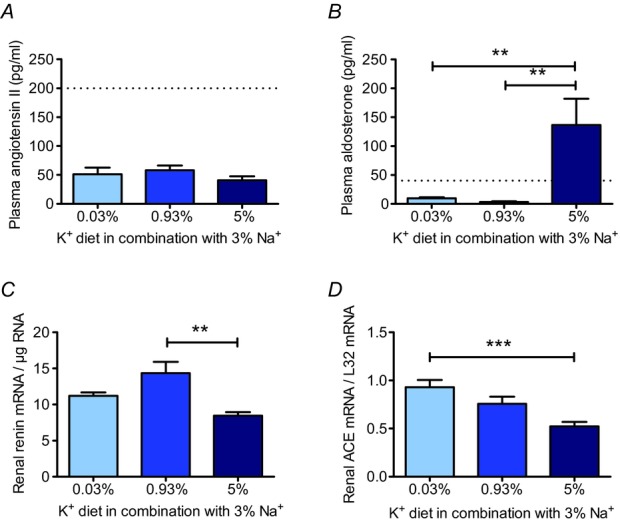
A, in all three K+ groups, plasma angiotensin II levels were reduced (mean ± s.e.m; n = 5 each). B, in the high K+ group, plasma aldosterone concentration was significantly increased (mean ± s.e.m; n = 8–9 each). C, in the high K+ group, renin mRNA was significantly reduced (mean ± s.e.m; n = 8 each). D, renal ACE mRNA level (mean ± s.e.m; n = 8 each) was highest in the low K+ group. (**P < 0.01, ***P < 0.001, one-way ANOVA). Dashed lines in A and B indicate plasma angiotensin II and aldosterone concentrations found in mice on the control diet.