
Figure 10.
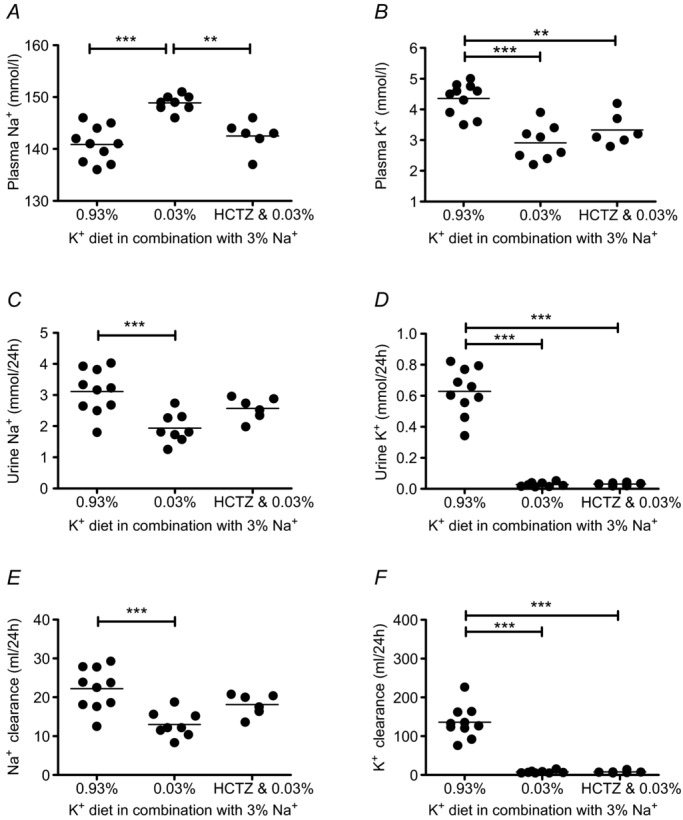
Plasma Na+ concentration (A), Na+ excretion (C) and Na+ clearance (E) during hydrochlorothiazide (HCTZ) treatment (14.3 ± 1.0 mg kg−1 per day) in the low K+ group. Renal K+ handling was not influenced by HCTZ treatment (B, D, F). Mice received experimental diets for 10 days and were housed in metabolic cages at the end of the experimental period. HCTZ treatment started 1 day prior to diet and was continued for 11 days (mean ± s.e.m; n = 6–10 each diet; **P < 0.01, ***P < 0.001, one-way ANOVA).