
Figure 11.
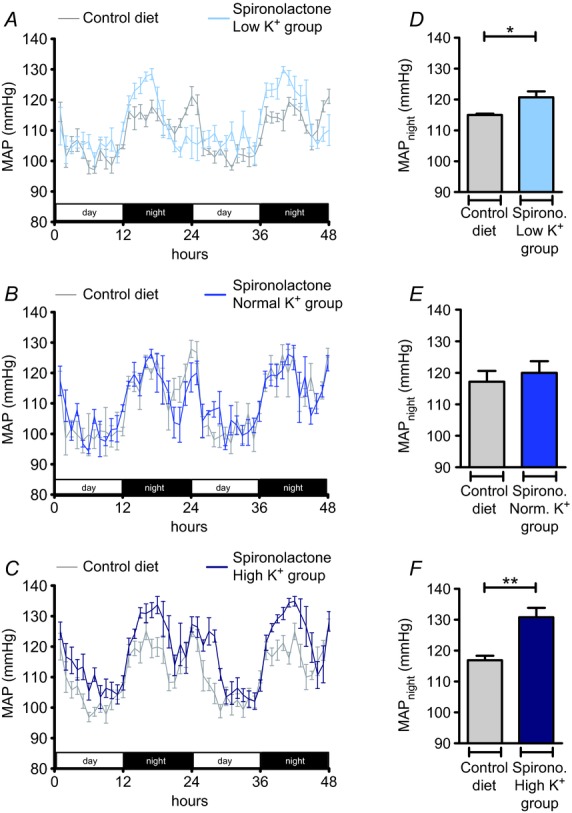
A–C, time course of mean arterial pressure (MAP) in mice in the low K+ (A, 0.03% K+, 3% Na+; n = 5), normal K+ (B, 0.93% K+, 3% Na+; n = 3) and high K+ (C, 5% K+, 3% Na+; n = 5) groups treated with spironolactone (175 mg kg−1 per day) compared with MAP in mice on the control diet (0.93% K+, 0.24% Na+). D–F, MAPnight in mice on the control diet in comparison with MAPnight in mice treated with spironolactone and the experimental diets. (Mean ± s.e.m; *P < 0.05, **P < 0.01, Student's paired t test).