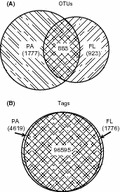
Figure 3.

(A) Venn diagram showing operational taxonomic unit (OTU) distribution between fractions, and (B) Venn diagram showing tag distribution between fractions. The size of the circles is proportional to the number of OTUs in (A) and the number of tags in (B). Plots were obtained in http://bioinforx.com/free/bxarrays/venndiagram.
