
Figure 5.
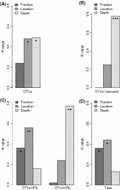
Barplots showing results of ANOSIM analysis (R value). (A) Analysis carried out with Bray–Cutis distance matrix, (B) analysis carried out with Jaccard similarity index matrix, (C) analysis carried out with Bray–Curtis distance matrices for abundant OTUs (>2% of total bacterial abundance in at least one of the samples) and rare OTUs (<2%), and (D) analysis carried with Bray–Curtis distance matrix for OTUs grouped in taxa (see M&M for criteria). The stars inside the bars indicate significance of ANOSIM values. Significance codes: ***(<0.001), **(<0.01), *(<0.05). The lack of stars indicates no signif-icance. ANOSIM, analysis of similarities; OTUs, operational taxonomic units.