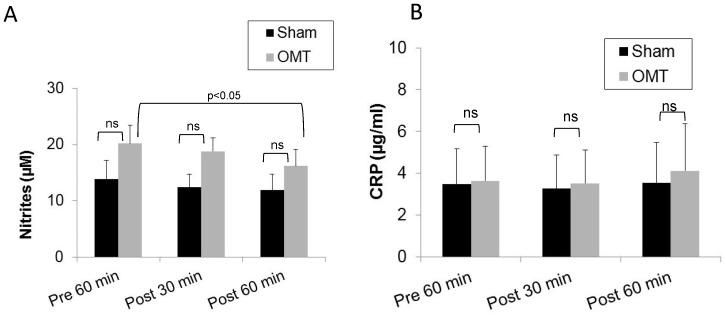
Figure 4. Levels of nitrites and CRP in plasma of OMT and sham experimental groups at 30 and 60-treatment.
Plasma was recovered from blood samples and analyzed for the presence of nitrites (A) and CRP (B) as described in the Materials and Methods section. Data are expressed as mean ± SD. Data were analyzed by ANOVA followed by Tukey-Kramer Multiple Comparisons post-test. N = 16 OMT and 17 sham.

