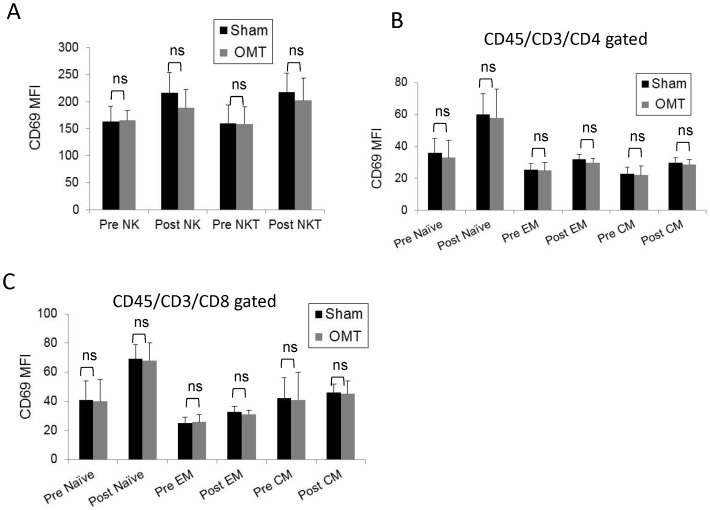
Figure 7. Activation status of circulating NK, NKT and T cell populations in OMT and sham experimental groups at 60-treatment.
Mean fluorescence intensity (MFI) values of CD69, an early activation antigen, were determined in NK and NKT cells (A), and Central and effector memory and naïve CD (B) and CD8 (C) T cells. Data are expressed as mean ± SD. Data were analyzed by ANOVA followed by Tukey-Kramer Multiple Comparisons post-test. N = 16 OMT and 17 sham.

