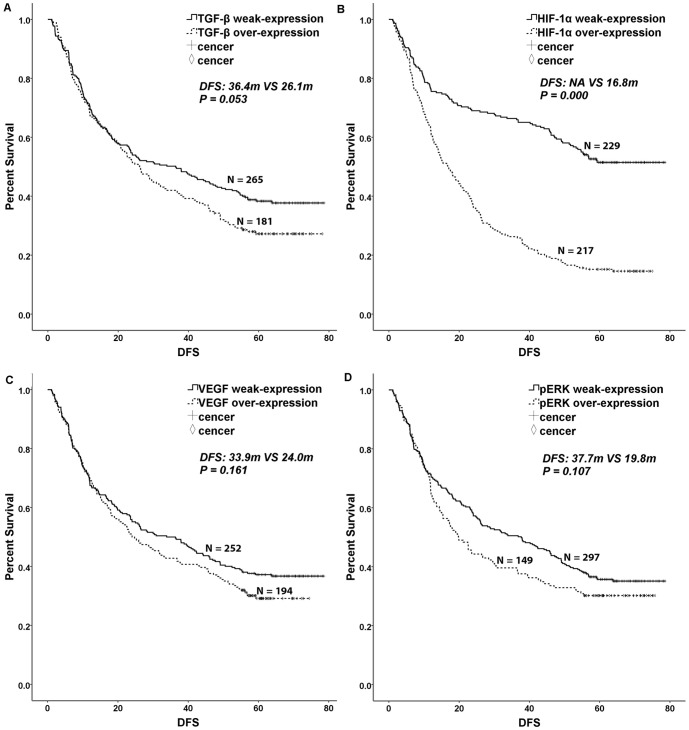
Figure 2. Kaplan-Meier curves for disease-free survival.
TGF-β, HIF-1α, VEGF and pERK 1/2 overexpression were divided into an overexpression group and a weak-expression group. A log-rank test was used to calculate significance. A. Disease-free survival curves stratified by TGF-β expression (P = 0.053). B. Disease-free survival curves stratified by HIF-1α expression (P = 0.000). C. Disease-free survival curves stratified by VEGF expression (P = 0.161). D. Disease-free survival curves stratified by pERK 1/2 expression (P = 0.107).

