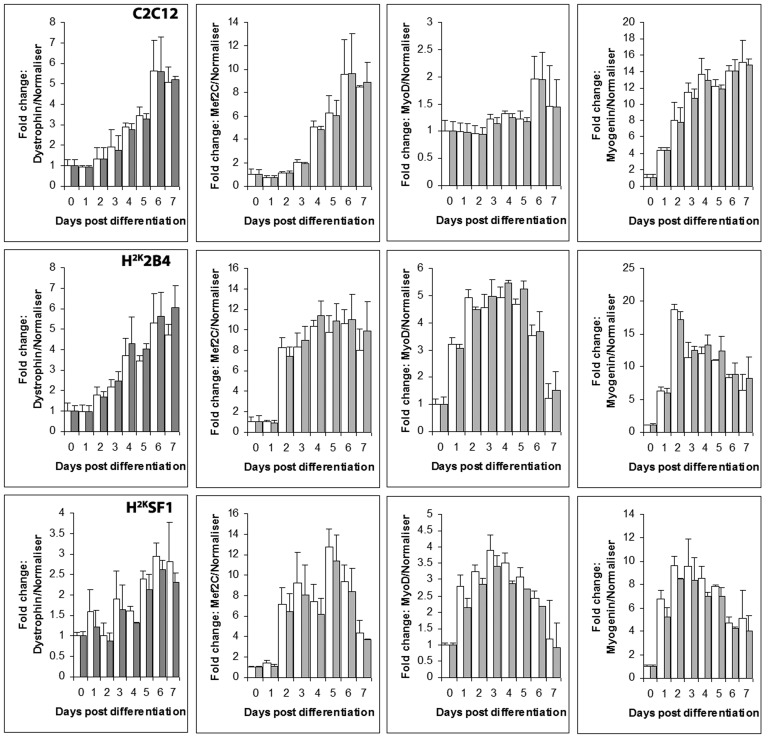
Normalizing with Csnk2a2 alone vs Csnk2a2 and Ap3d1.
Relative expression levels of dystrophin, MEF2C, MyoD and myogenin (left to right) in C2C12 (top) 2B4 (middle) and SF1 (bottom) cell lines, normalized to Csnk2a2 (white bars) or to the geometric average of Csnk2a2 and Ap3d1 (grey bars). Data expressed as means +standard deviations. All data presented as fold change from undifferentiated (day 0) expression level.

