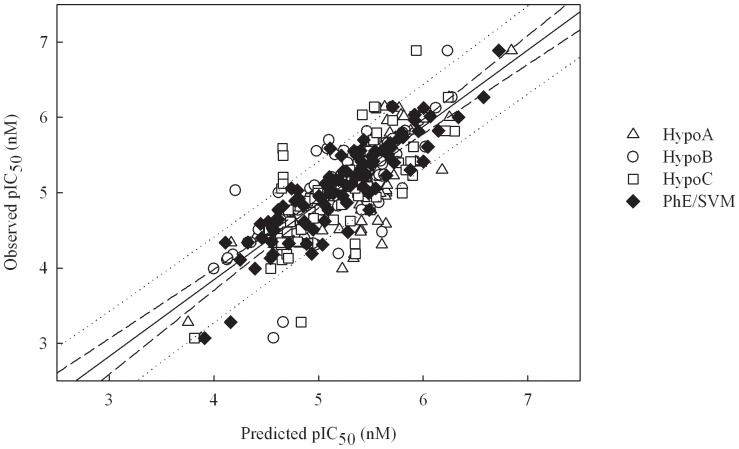
Figure 5. Observed vs. predicted pIC50 values in the test set.
Observed pIC50 vs. the pIC50 predicted by Hypo A, Hypo B, Hypo C, and PhE/SVM for those molecules in the test set. The solid line, dashed lines, and dotted lines correspond to the PhE/SVM regression of the data, 95% confidence interval for the PhE/SVM regression, and 95% confidence interval for the prediction, respectively.

