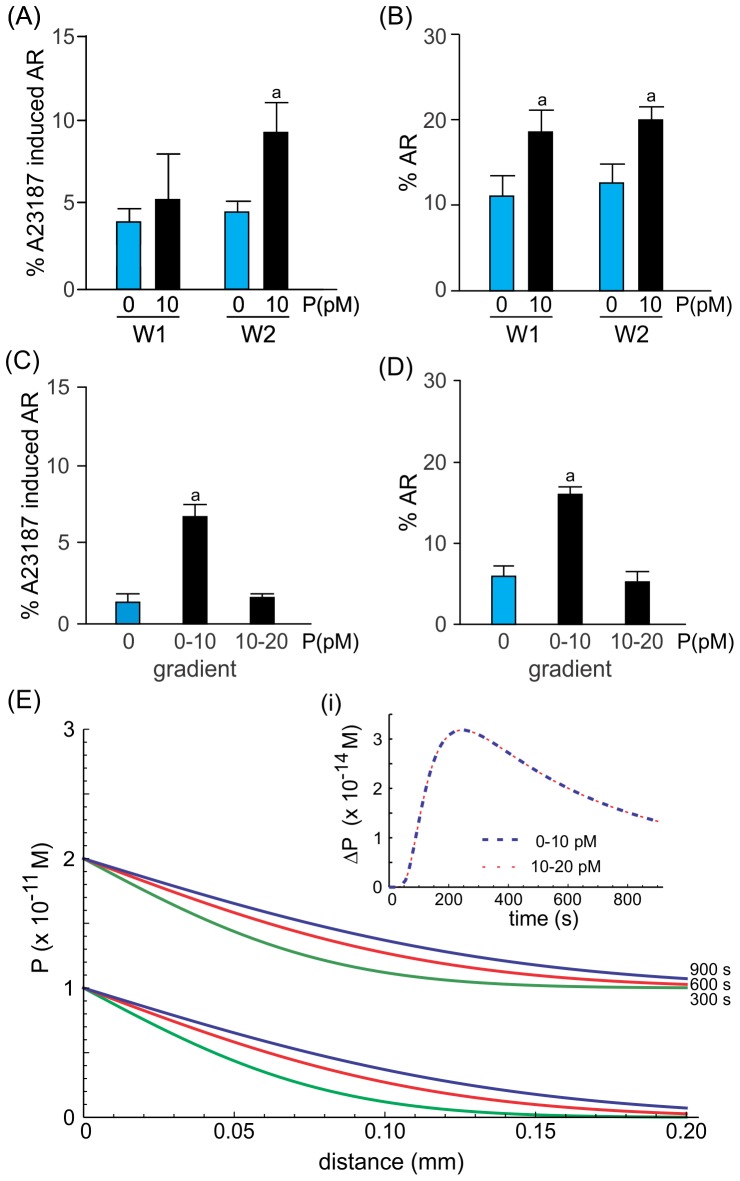
Figure 3. Picomolar gradients of progesterone generated in the SSA chamber stimulate either priming or the acrosome reaction in different sperm subpopulations.
Percentage of spermatozoa primed (A) or acrosome-reacted (B) after a 20 min exposure to a gradient of 10 pM progesterone. Data are shown as means ± s.e.m. calculated from 5 independent experiments, counting 200–600 cells per well per treatment. a, significant differences vs. without progesterone (p<0.05). Percentage of spermatozoa-primed (C) or acrosome-reacted (D) exposed to 0–10 pM or 10–20 pM of progesterone gradients. Data are shown as means ± s.e.m. calculated from 5 independent experiments, counting 200–600 cells per well per treatment. a, significant differences vs. the other treatments (p<0.05). E, theoretical progesterone gradient formation over time and the connection between wells, when spermatozoa are exposed to 0–10 pM or 10–20 pM gradient of progesterone. In each set of curves, the lower represents time = 300 s, the middle = 600 s, and the upper = 900 s. The inset (i) represents the ΔP in the middle of the connection between both wells, for a 0–10 pM (blue dash line) and 10–20 pM (red dashed line) gradients.

