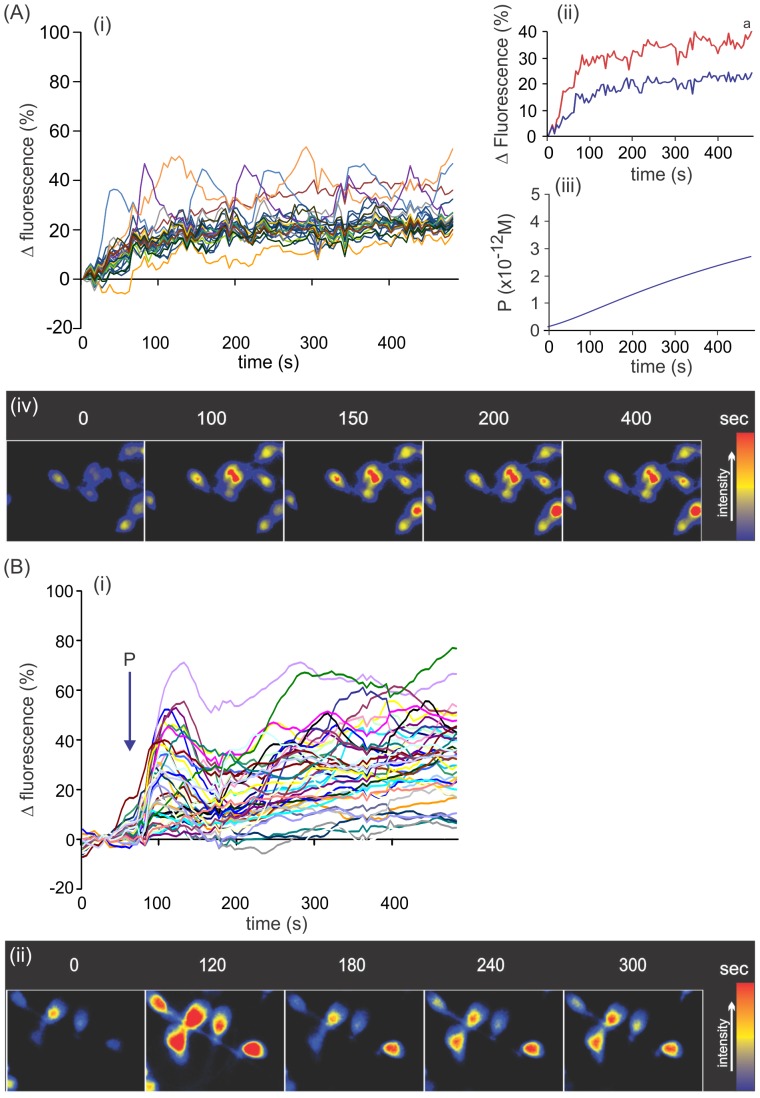
Figure 4. Picomolar gradients of progesterone stimulate singular intracellular calcium changes in spermatozoa.
A, cells exposed to a gradient of 10; Aii, comparison of the curves showing mean values of the subpopulation of oscillating sperm with calcium values higher than the mean population value (red) and the mean of the rest of the cells (blue); Aiii, absolute progesterone concentration in the middle of the CH chamber along time where the starting point corresponds to 2 min due to the delay between CH sealing and start of recording. a, significant differences vs. the blue curve (p<0.0001). B, cells exposed to a step application of 10 pM progesterone. Bi, calcium variations in several single cells along time. Representative images of several sperm cells exposed either to a gradient or a step 10 pM progesterone (Aiv and Bii, respectively). In Ai and Bi, data are shown as calcium variation expressed as relative fluorescence intensity (%) of individual cells of one representative experiment of five, analyzing 50 cells per treatment and experiment.

