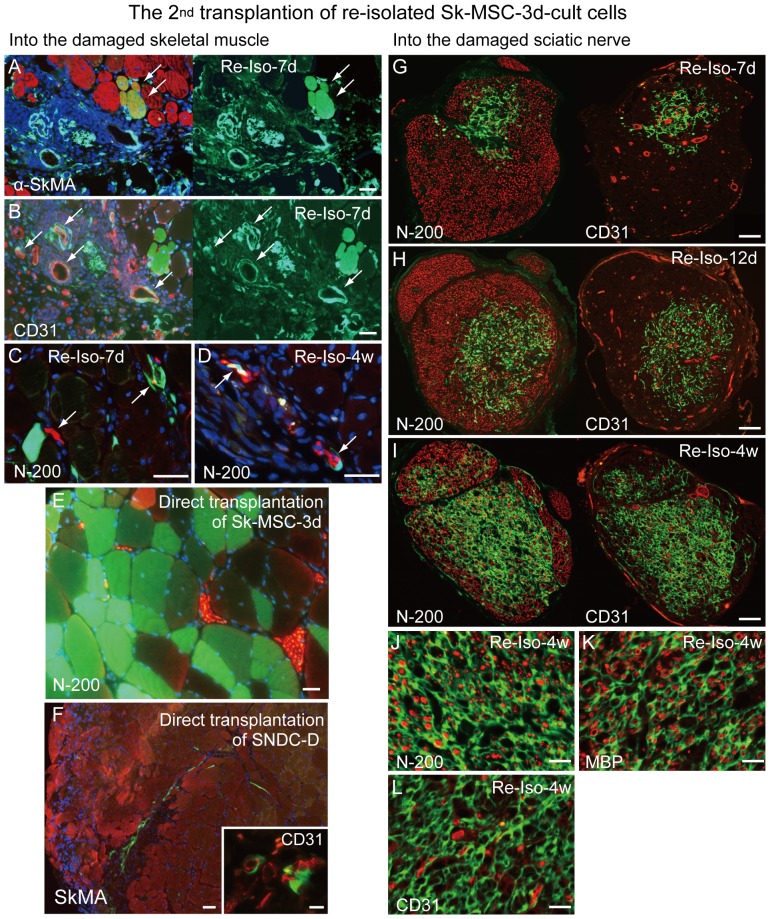
Figure 7. In vivo differentiation potential of re-isolated Sk-MSC-3d after “2nd transplantation” into damaged skeletal muscle and sciatic nerve.
To confirm the differentiation potential of once engrafted Sk-MSC-3d, GFP+ cells were re-isolated from transplanted crushed nerves (using same method as described in previous RT-PCR analysis) from 1st transplanted mice (n = 10), and re-transplanted into both the damaged skeletal muscle and sciatic nerve models (2nd transplantation). Re-isolation and 2nd transplantation were performed at 7, 12, 17 days and 4 weeks after 1st transplantation (n = 3 in each stages in both the damaged skeletal muscle and sciatic nerve), and final sampling was performed at 4 weeks after 2nd transplantation. The left column shows transplantation into damaged skeletal muscle, and the right column shows transplantation into damaged sciatic nerve. (A) Some GFP+ muscle fibers were detected in limited areas (arrows in A). (B, C) Incorporation of GFP+ cells to the vascular (arrows in B) and peripheral nerve (arrows in C) tissues were also evident. There were no GFP+ muscle fibers detected thereafter, with a lower rate of cellular engraftment (at 12 and 17 days, data not shown). (D) Few GFP+ cells related to nerves were seen in the case of re-isolated-4w (arrows in D). (E) There was a large number of GFP+ muscle fibers near the N-200+ nerve bundles when Sk-MSC-3d were directly transplanted into damaged muscle (as 1st transplantation), thus indicating vigorous skeletal myogenic potential. These data indicate that diminished engraftment capacity of Sk-MSC-3d is associated with reduced myogenic potential in the 2nd transplantation. (F) When original SNDC-D was directly transplanted into damaged skeletal muscle niche, they were unable to differentiate into muscle fibers, and their engraftment capacity was quite low. (G–I) 2nd transplantation of re-isolated Sk-MSC-3d cells at -7d (G), -12d (H) and -4 w (I) into damaged sciatic nerve. Number of engrafted cells increased gradually with time after 2nd transplantation. (J–L) Similar trends in cell differentiation which was observed in 1st transplantation were seen for 2nd transplantation (refer to Figs. 2 and 3). Scale bars represent 50 µm (A–F, and J–L), 20 µm (inset of F) and 200 µm (G–I).

