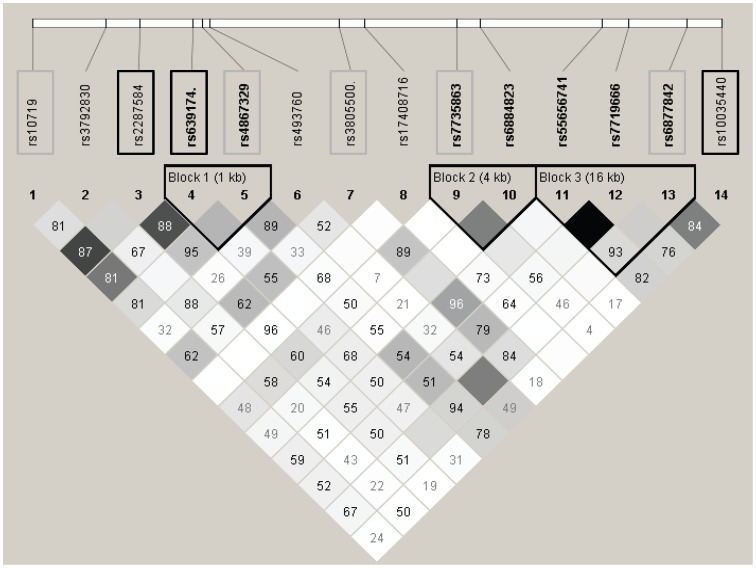
Figure 1. Linkage disequilibrium plot of the SNPs analyzed in DROSHA.
White: r2 = 0, shades of grey: 0<r2<1, black: r2 = 1. Numbers in squares are D' values. Block definition is based on the Gabriel et al. method. The SNPs associated with toxicity are squared. Those among the top 10 associated SNPs are squared in black

