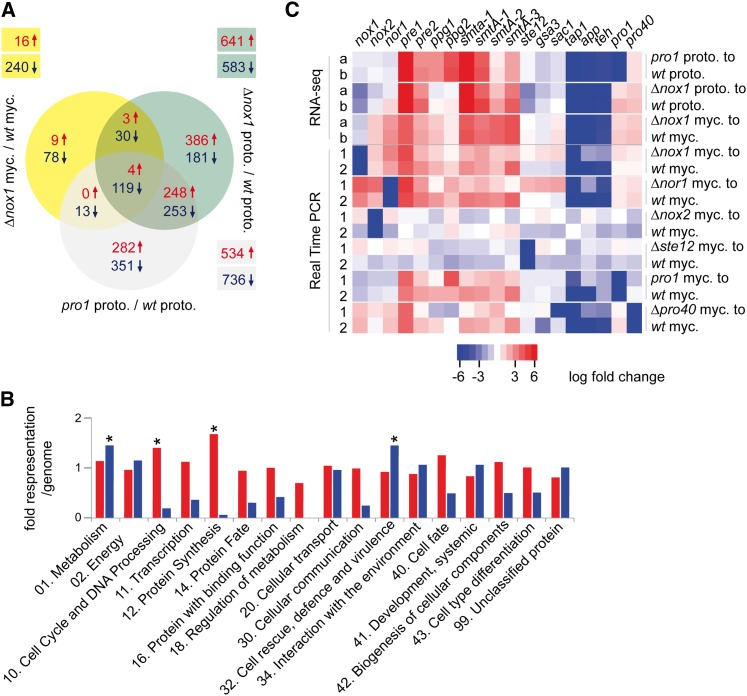
Figure 4.
Results of RNA-seq-based expression analysis in developmental mutants. (A) Consensus analysis of differentially regulated genes identified by DESeq and classical statistical methods. Differentially regulated genes in relation to the corresponding wild-type tissue are indicated in yellow (∆nox1 mycelia), green (∆nox1 protoperithecia), and gray (pro1 protoperithecia). The numbers of up- (↑, red) and down- (↓, blue) regulated genes are indicated. (B) Illustration of functional categories (FunCat) (Ruepp et al. 2004) of up- (red) and down- (blue) regulated genes in protoperithecia from ∆nox1 mutant compared to wild-type protoperithecia. For each FunCat category, the fold representation compared to its representation among all predicted proteins is given. Asterisks indicate statistically overrepresented functional groups (P-value ≤ 0.05). (C) Heatmap of regulated genes in RNA-seq and qRT-PCR experiments using RNA from protoperithecia (proto.) and mycelium (myc.). Different statistical analyses are indicated by “a” (DESeq) and “b” (classical). Numbers (1 and 2) indicate biological replicates. Up- (red) and down- (blue) regulated genes are indicated.

