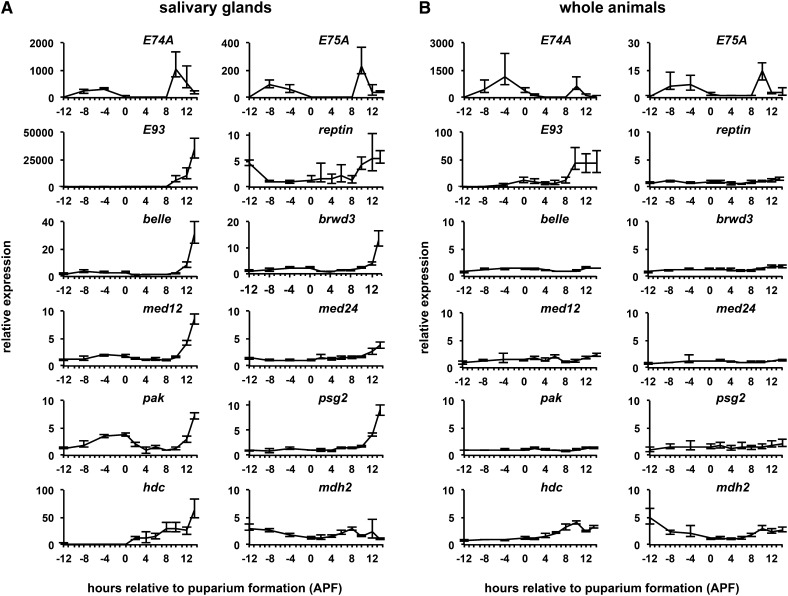
Figure 3.
Most PSG genes show stage- and tissue-specific expression profiles. (A and B) Developmental expression profiles of target genes measured by qPCR in dissected salivary glands (A) or in whole animals (B). Previously characterized ecdysone target genes E74A and E75A show strong induction in response to the late larval (at −4 APF) and prepupal (at +10 APF) pulses of ecdysone, while E93 responds only to the prepupal pulse. Most PSG genes, however, show strong induction after the prepupal pulse of ecdysone in salivary glands yet remain relatively flat in whole animals. The y-axis plots relative expression measured by qPCR for each target gene compared to the stage with the lowest expression. The x-axis plots developmental stage relative to puparium formation in control salivary glands and whole animals. Each time point represents three independent biological samples normalized to rp49.

