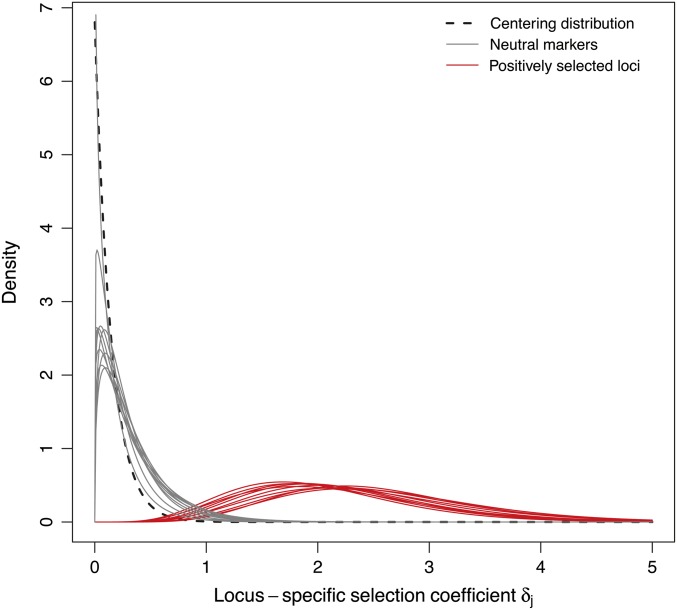
Figure 2.
Examples of posterior densities of the locus-specific hyperparameter δj for neutral markers (in gray) and positively selected loci (in red). The “centering” distribution (dashed line) is derived from the hyperdistribution of the genome-wide effect of selection, λ, and is defined as an exponential distribution , where is the posterior mean of λ, as estimated from the MCMC.

